SarlackLab C2 Tracking
Kicking ACKs and taking domain names
Abused Parent-Domain Forest
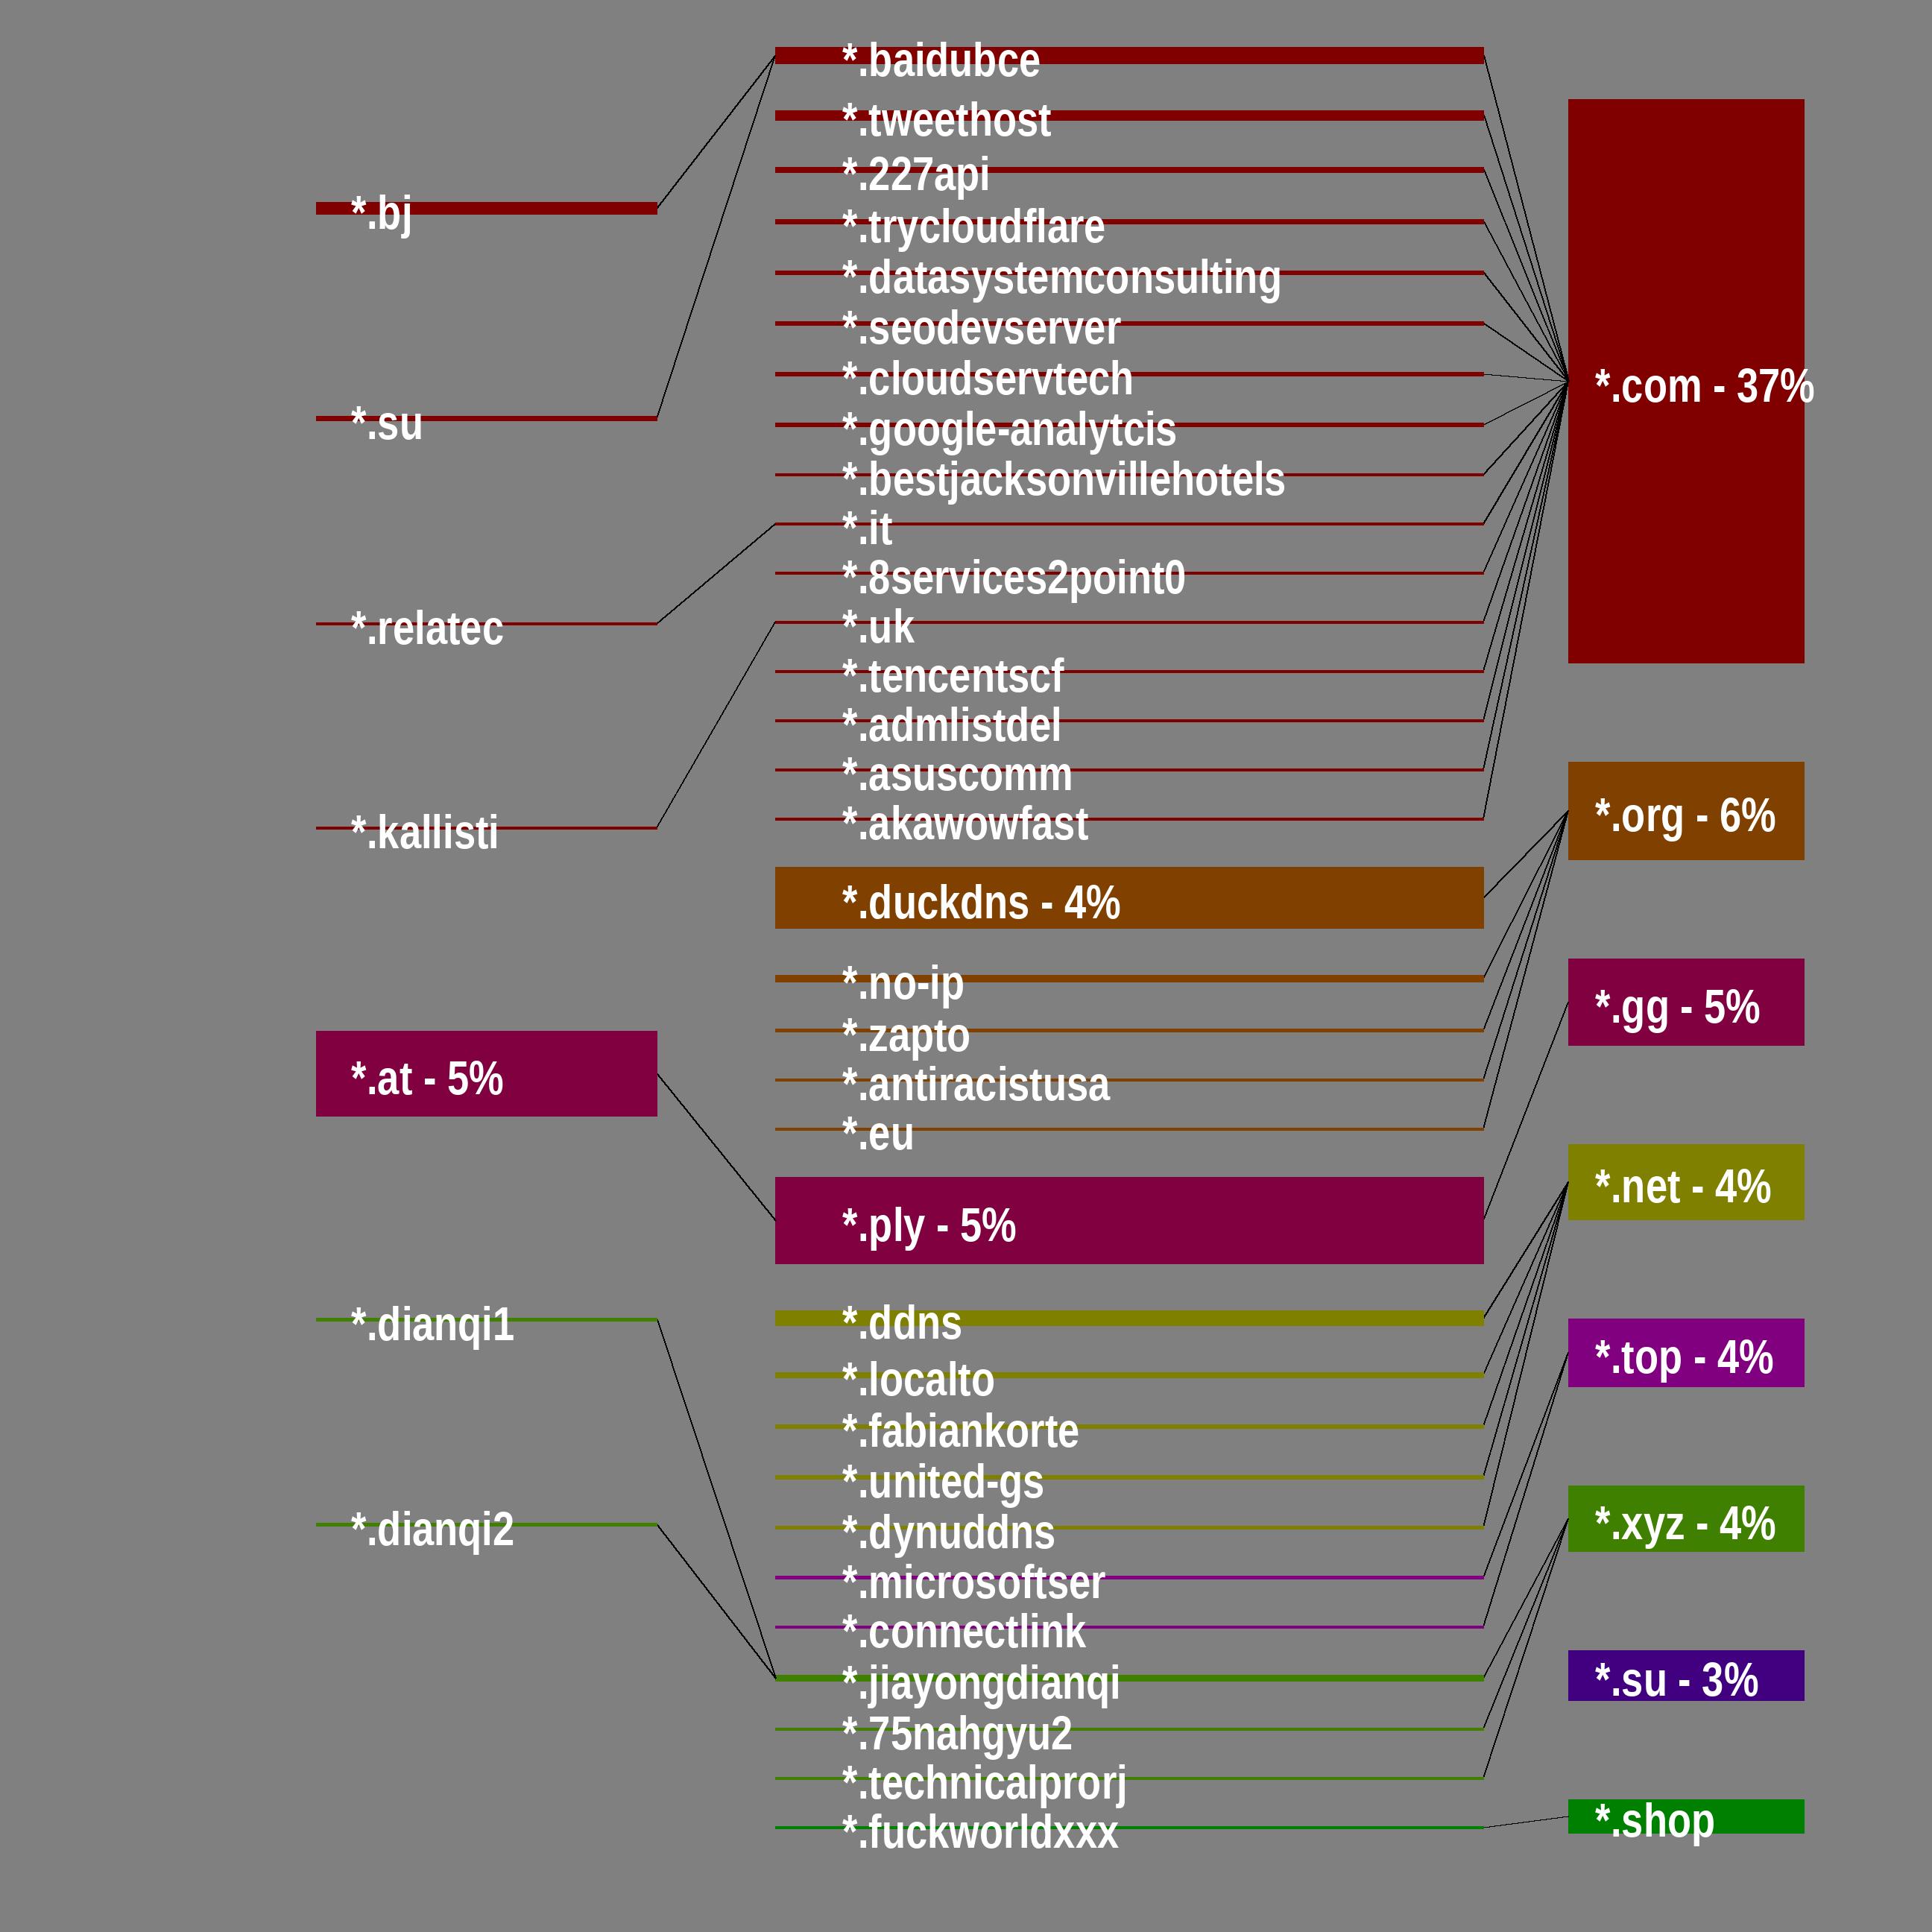
Only domain trees from most common 8* C2 shown
Follow @SarlackLab on BlueSky/Mastodon for daily updates on malicious servers
Map history and C2 trends available in /C2-Logs/ directory
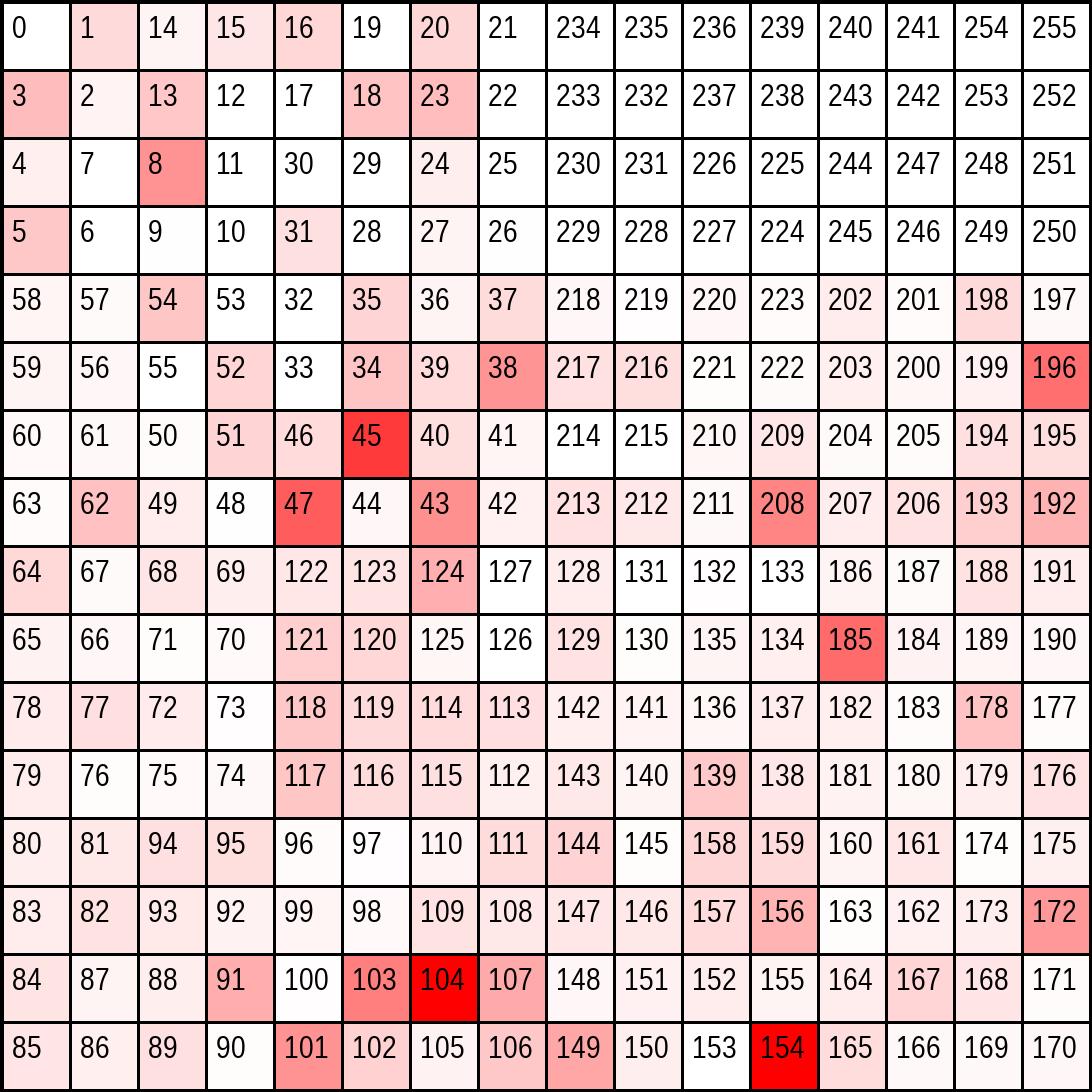
The redder: a square appears, the more command-and-control (C2) servers are hosted in that /8 space.
XKCD has a comic explaining IPv4 Hilbert curves
Concerning Ranges
- 154.89.184.0/21
- 104.140.144.0/20
- 208.87.200.0/21
- 104.206.234.0/23
- 149.30.224.0/19
- 38.32.0.0/11
- 38.128.0.0/9
- 124.220.0.0/14
- 91.92.240.0/22
- 178.16.52.0/22
Dangerous Subnets
- 104.206.234.0/23
- 62.60.131.0/24
- 154.89.184.0/21
- 208.87.200.0/21
- 147.185.221.0/24
- 185.241.208.0/24
- 196.251.114.0/23
- 124.198.132.0/24
- 196.251.116.0/23
- 91.92.240.0/22
Heatmap of /8 Spaces Across IPv4
About Sarlack-Lab
I built the Sarlack to "devour malware in a sandbox". The server automatically grabbed and analyzed malware samples for personal research and to assist my SOC. While studying network detection trends, I began to notice patterns among malicious IP addresses and abused parent-domains. I created maps to visualize this threat landscape using the fantastic resources provided by abuse.ch, drb-ra, Dee, Fred HK, Benkow_, Good__Bear, and Paul Melson (as well as the IOCs that the Sarlack uncovers too).
Read more about Sarlack-Lab map generation here